Augmenting with object data:
Geo-objects such as microwave links and locations can be augmented with object data.
This provides users with all relevant information at a glance, enabling workflows to be designed efficiently.
All object data are stored in a powerful, relational database. A wide range of TMF compliant interfaces permit multi-source analyses to be created and displayed in a central web interface.
Report engine:
The reporting module uses intelligent queries to combine data into meaningful reports, which are then displayed in table form and in selectable, modern charts in the web frontend.
The tight integration with other applications means that multi-source reports can also be generated.
Reports can be exported in all popular formats like Excel and PDF.
Customised reports:
- Reports with freely configurable columns
- Filtering and sorting can be performed on all columns
- Data and charts can be exported in all popular formats (such as Excel, PDF, CSV, Access etc.)
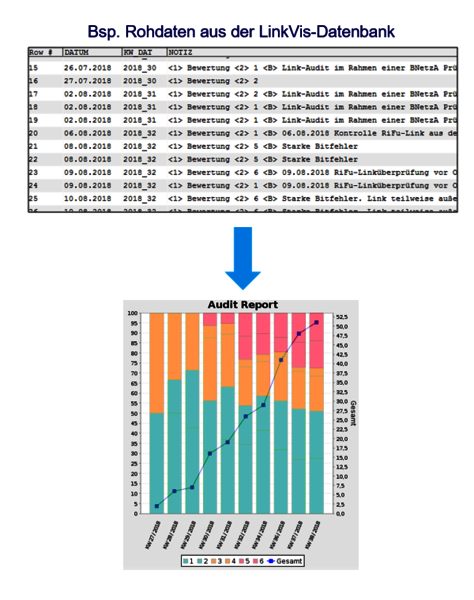
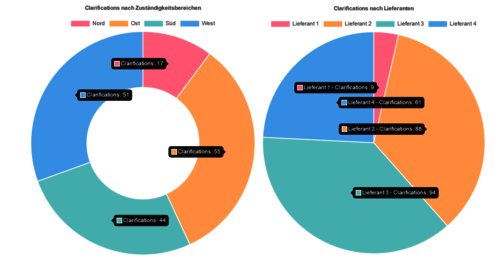
- Visualisation of data in various forms such as bar, line and pie charts
- It is possible to display multiple values in a single chart
- All charts are fully interactive (filtering, zoom function, value type)
- Configurable e-mail notification at fixed intervals or when the underlying data change
- Report parameters, filter and value types can be saved for the specific user
- Data that were captured manually or imported can be evaluated at freely configurable intervals
- They can be placed in the context of the time they occurred or can be grouped by type of clarification
- Analyses can be output to a web interface, Microsoft Office or PDF file
- Data maintenance is effected via a web form in LinkVis, by mass import via an interface or importing from Excel
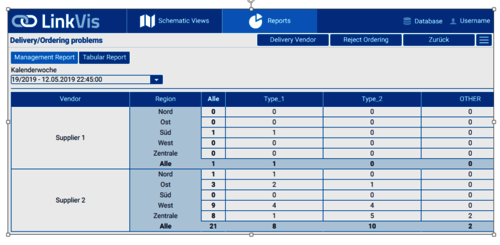
- The table output of clarifications provides a snapshot grouped by supplier, region and clarification type. Placing the data in the context of time allows the occurrence of problems to be analysed and evaluated for different departments or suppliers.
- Labels can be configured and adapted to match requirements. The main subdivision into causer and their department or responsibility is retained.
- The Type_1, Type_2 and OTHER columns represent clarification reasons and are automatically transferred from the evaluated data.
- The displayed data can be output in a flat table which in turn can serve as a to-do list and can be exported in various formats.
Network design review
The report shown bleow is used to compare planning data with live network data. Differences are recorded and displayed either in a table or a chart. They can be exported to Microsoft Office or analysed directly in the web application.
This is only one small part of the analyses that can be performed; others can cover fade margins, redundancy checks, microwave link aggregation, ATPC control ranges etc. The underlying engine is set up generically and can be extended as desired.


